交易
·
·

交易
技术分析基础
3 min read
Contents
01
intro
02
What Is Technical Analysis?
03
Charts and Timeframes
04
Support and Resistance
05
Trendlines and Channels
06
Indicators
07
Patterns
08
Why It Matters
09
Conclusion


01
intro
在最后一集,我们讨论了风险管理,这是一系列通过限制损失和保护资本使交易者继续参与市场的实践。这次,我们转向技术分析,这是对价格图表和模式的研究,交易者用它来对市场方向做出明智的决策。
技术分析并不是要以确定性预测未来。相反,它提供了一个框架,用于分析历史数据以确定可能性。交易者依赖它来理解市场行为、发现趋势,并明确进出点。
什么是技术分析?
技术分析是通过研究价格波动和交易量对证券进行评估的实践。它不侧重于公司的基本面,而是认为所有相关信息已在市场价格中反映。
通过分析过去的数据,交易者寻找可能指示价格将要移动的位置的重复模式和信号。
从根本上说,技术分析是关于理解图表上出现的供求动态。
图表和时间框架
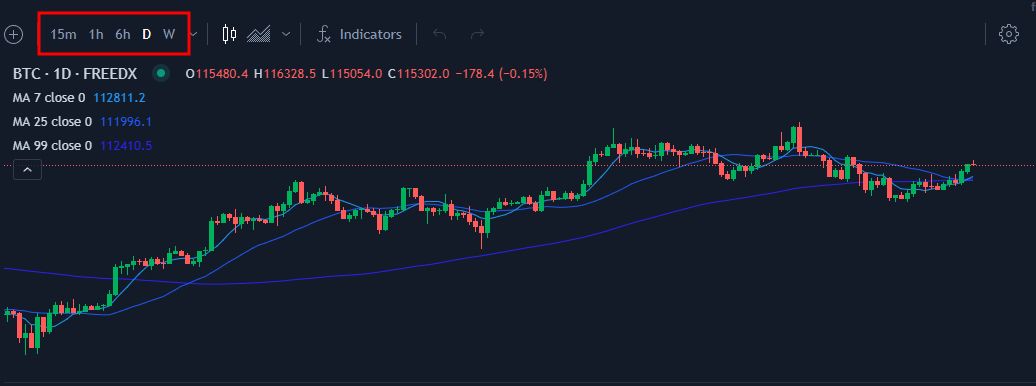
技术分析的基础是价格图表。图表可视化资产随时间的变动,并可以根据交易者的策略调整到不同的时间框架。
一分钟图表显示适合日内交易者的短期波动。每日或每周图表揭示适合摆动交易者和投资者的长期趋势。
蜡烛图常被使用,因为它们在一个图表中显示开盘价、高价、低价和收盘价,提供比线图更多的细节。
支撑和阻力
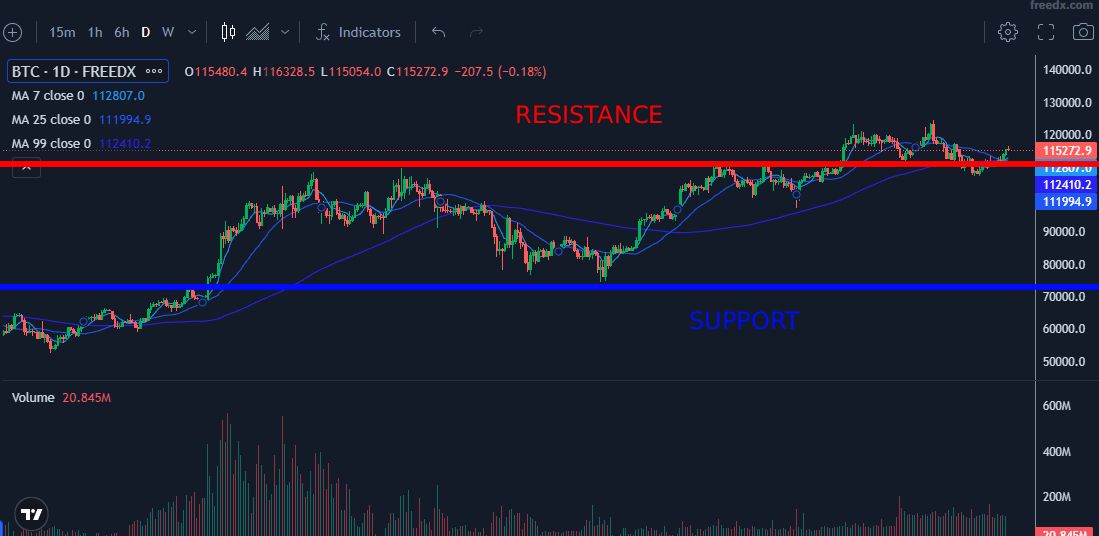
支撑是过去历史上需求防止进一步下跌的价格水平。阻力是销售压力倾向于限制上涨的水平。
这些水平帮助交易者预测价格可能停顿或反转的位置。突破支撑可能会信号进一步下行,而突破阻力可能意味着持续的强势。
支撑和阻力并不是精确的数字,而是价格反应经常发生的区域。
趋势线和通道
趋势线连接图表上的连续高点或低点,帮助可视化市场的方向。上升趋势线表示更高的低点,而下降趋势线则显示较低的高点。
通道是通过在高点和低点之间画平行线形成的。它们突出了价格通常移动的边界。交易者用它们来寻找突破或在通道内交易,直到条件发生变化。
指标
指标是基于价格和交易量的数学计算,提供额外的背景信息。
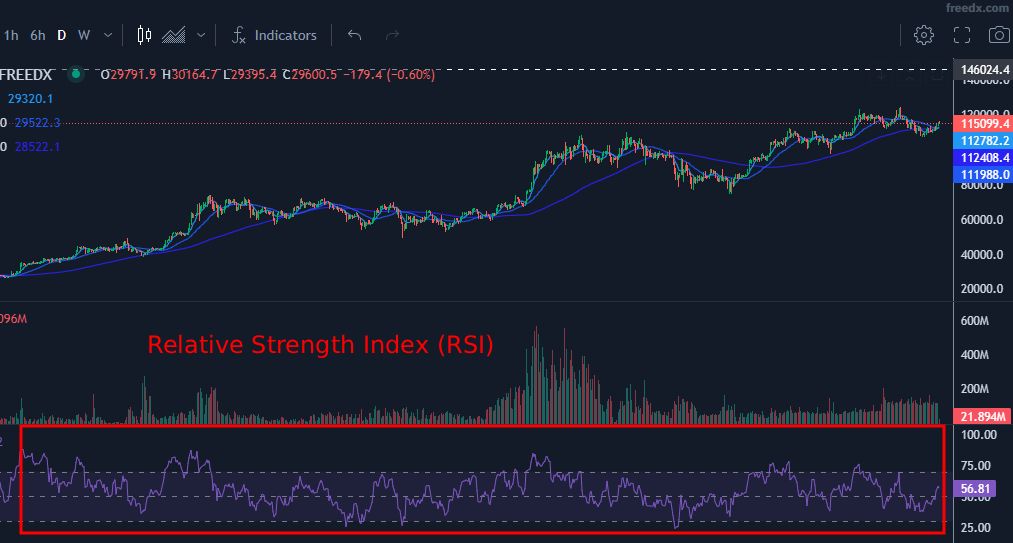
移动平均线平滑价格数据,以揭示潜在趋势。相对强弱指数(RSI)通过比较近期的涨幅和跌幅来衡量动量。移动平均收敛发散(MACD)跟踪短期和长期移动平均之间的关系,以识别动量变化。
指标并不替代价格行为,而是通过提供确认或警告信号来补充它。
模式
图表模式是反映集体市场行为的重复形态。
持续模式如旗形或三角形表明现有趋势可能会恢复。反转模式如头肩顶或双顶则指示可能的方向变化。
模式不是保证,而是框架概率的工具。交易者在采取行动之前将其与其他分析形式相结合。
为什么这很重要
技术分析为交易决策提供结构。交易者不再依赖情绪或随机噪声,而是依赖明确的水平、信号和概率。
它允许一致的规划、更清晰的执行和可测量的风险。与风险管理相结合,技术分析成为在不确定市场中导航的实用工具。
结论
技术分析是研究价格和交易量以识别潜在市场方向。图表和时间框架提供基础。支撑和阻力定义关键水平。趋势线和通道揭示方向。指标增加确认。模式突出重复行为。
对于初学者来说,学习图表和识别支撑与阻力是第一步。对于经验丰富的交易者来说,结合多种工具可以优化时机并改善决策。
技术分析并不能消除不确定性,但它为交易者提供了一个结构化的框架来应对这些不确定性。
02
What Is Technical Analysis?
Technical analysis is the practice of evaluating securities by studying price movements and trading volume. Instead of focusing on a company’s fundamentals, it assumes that all relevant information is already reflected in the market price.
By analyzing past data, traders look for recurring patterns and signals that may indicate where price is likely to move next.
At its core, technical analysis is about understanding supply and demand dynamics as they appear on a chart.
03
Charts and Timeframes
The foundation of technical analysis is the price chart. Charts visualize how an asset has moved over time and can be adjusted to different timeframes depending on the trader’s approach.
A one-minute chart shows short-term fluctuations useful for day traders. A daily or weekly chart reveals longer trends suited for swing traders and investors.
Candlestick charts are commonly used because they display open, high, low, and close prices in a single bar, offering more detail than line charts.
04
Support and Resistance
Support is a price level where demand historically prevents further decline. Resistance is a level where selling pressure tends to cap upward movement.
These levels help traders anticipate where price might pause or reverse. Breaking through support can signal further downside, while breaking resistance can suggest continued strength.
Support and resistance are not exact numbers but zones where price reactions often occur.
05
Trendlines and Channels
Trendlines connect successive highs or lows on a chart, helping to visualize the direction of the market. An upward trendline indicates higher lows, while a downward trendline shows lower highs.
Channels are formed by drawing parallel lines along both highs and lows. They highlight the boundaries within which price often moves. Traders use them to spot breakouts or to trade within the channel until conditions change.
06
Indicators
Indicators are mathematical calculations based on price and volume that provide additional context.
Moving averages smooth price data to reveal the underlying trend. The Relative Strength Index (RSI) measures momentum by comparing recent gains and losses. The Moving Average Convergence Divergence (MACD) tracks the relationship between short and long term moving averages to identify shifts in momentum.
Indicators do not replace price action but complement it by offering confirmation or warning signals.



07
Patterns
Chart patterns are recurring formations that reflect collective market behavior.
Continuation patterns such as flags or triangles suggest the existing trend is likely to resume. Reversal patterns such as head and shoulders or double tops indicate a possible change in direction.
Patterns are not guarantees but tools to frame probability. Traders combine them with other forms of analysis before acting.
08
Why It Matters
Technical analysis provides structure to trading decisions. Instead of reacting to emotions or random noise, traders rely on defined levels, signals, and probabilities.
It allows for consistent planning, clearer execution, and measurable risk. Combined with risk management, technical analysis becomes a practical tool for navigating uncertain markets.
09
Conclusion
Technical analysis is the study of price and volume to identify potential market direction. Charts and timeframes provide the foundation. Support and resistance define key levels. Trendlines and channels reveal direction. Indicators add confirmation. Patterns highlight recurring behavior.
For beginners, learning charts and recognizing support and resistance are the first steps. For experienced traders, combining multiple tools refines timing and improves decision making.
Technical analysis does not eliminate uncertainty, but it gives traders a structured framework for approaching it.