Technical Analysis Basics
In the last episode, we looked at risk management, the set of practices that keep traders in the game by limiting losses and preserving capital. This time, we turn to technical analysis, the study of price charts and patterns that traders use to make informed decisions about market direction.
Technical analysis is not about predicting the future with certainty. Instead, it provides a framework for analyzing historical data to identify probabilities. Traders rely on it to understand market behavior, spot trends, and define entry and exit points.
What Is Technical Analysis?
Technical analysis is the practice of evaluating securities by studying price movements and trading volume. Instead of focusing on a company’s fundamentals, it assumes that all relevant information is already reflected in the market price.
By analyzing past data, traders look for recurring patterns and signals that may indicate where price is likely to move next.
At its core, technical analysis is about understanding supply and demand dynamics as they appear on a chart.
Charts and Timeframes
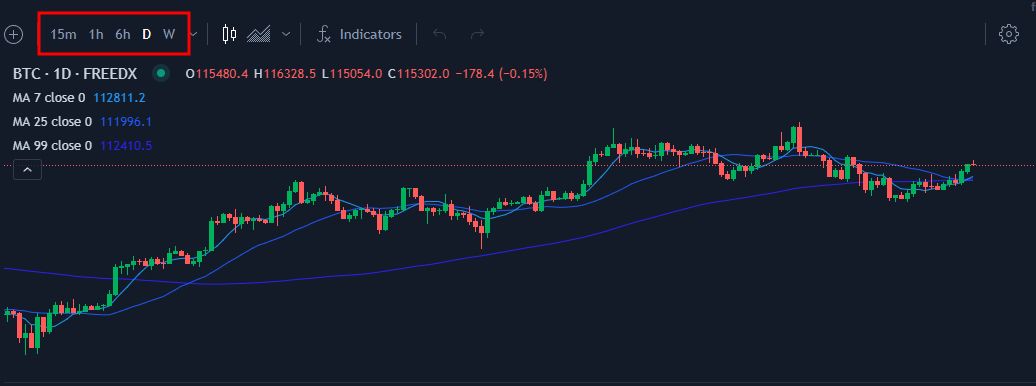
The foundation of technical analysis is the price chart. Charts visualize how an asset has moved over time and can be adjusted to different timeframes depending on the trader’s approach.
A one-minute chart shows short-term fluctuations useful for day traders. A daily or weekly chart reveals longer trends suited for swing traders and investors.
Candlestick charts are commonly used because they display open, high, low, and close prices in a single bar, offering more detail than line charts.
Support and Resistance
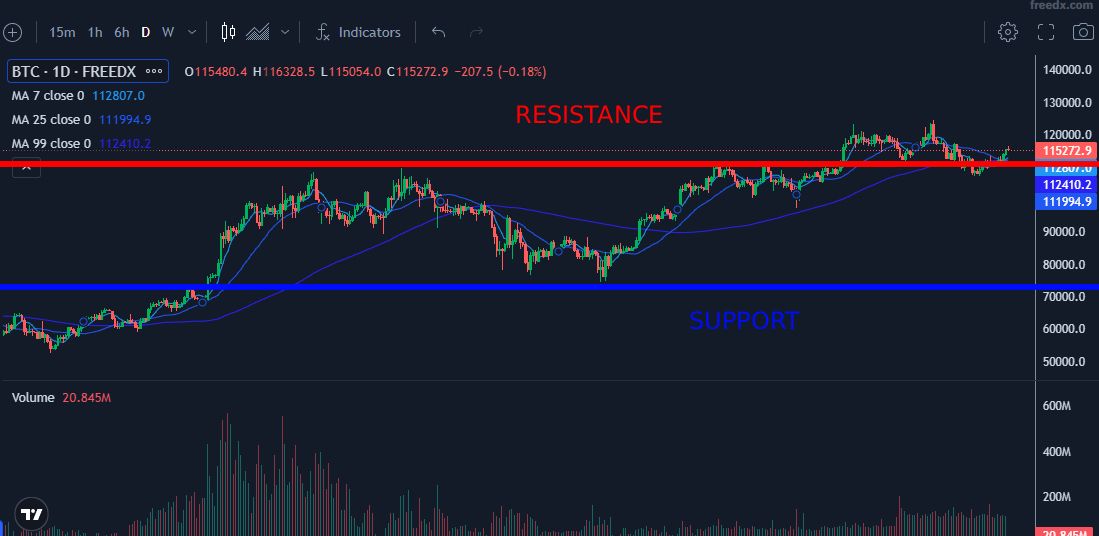
Support is a price level where demand historically prevents further decline. Resistance is a level where selling pressure tends to cap upward movement.
These levels help traders anticipate where price might pause or reverse. Breaking through support can signal further downside, while breaking resistance can suggest continued strength.
Support and resistance are not exact numbers but zones where price reactions often occur.
Trendlines and Channels
Trendlines connect successive highs or lows on a chart, helping to visualize the direction of the market. An upward trendline indicates higher lows, while a downward trendline shows lower highs.
Channels are formed by drawing parallel lines along both highs and lows. They highlight the boundaries within which price often moves. Traders use them to spot breakouts or to trade within the channel until conditions change.
Indicators
Indicators are mathematical calculations based on price and volume that provide additional context.
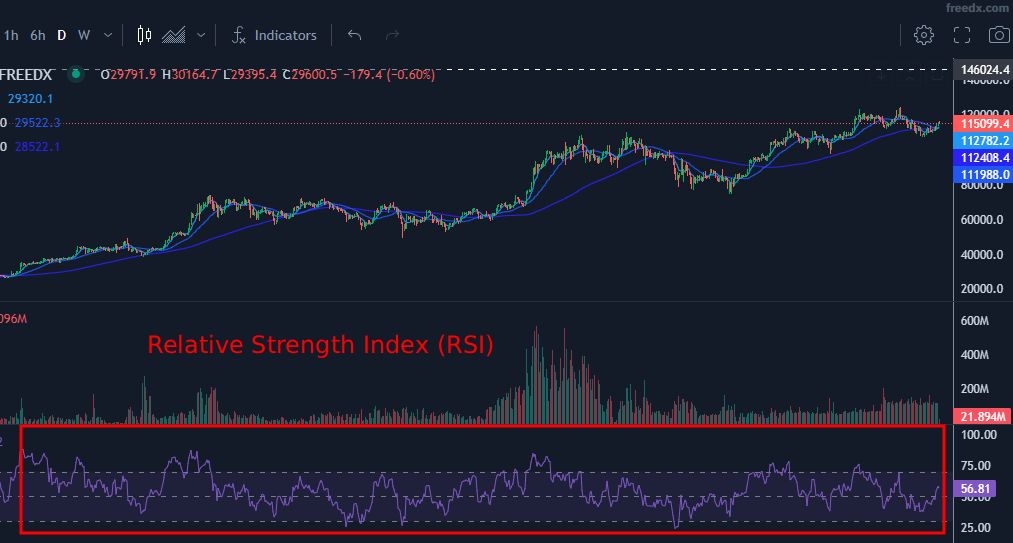
Moving averages smooth price data to reveal the underlying trend. The Relative Strength Index (RSI) measures momentum by comparing recent gains and losses. The Moving Average Convergence Divergence (MACD) tracks the relationship between short and long term moving averages to identify shifts in momentum.
Indicators do not replace price action but complement it by offering confirmation or warning signals.
Patterns
Chart patterns are recurring formations that reflect collective market behavior.
Continuation patterns such as flags or triangles suggest the existing trend is likely to resume. Reversal patterns such as head and shoulders or double tops indicate a possible change in direction.
Patterns are not guarantees but tools to frame probability. Traders combine them with other forms of analysis before acting.
Why It Matters
Technical analysis provides structure to trading decisions. Instead of reacting to emotions or random noise, traders rely on defined levels, signals, and probabilities.
It allows for consistent planning, clearer execution, and measurable risk. Combined with risk management, technical analysis becomes a practical tool for navigating uncertain markets.
Conclusion
Technical analysis is the study of price and volume to identify potential market direction. Charts and timeframes provide the foundation. Support and resistance define key levels. Trendlines and channels reveal direction. Indicators add confirmation. Patterns highlight recurring behavior.
For beginners, learning charts and recognizing support and resistance are the first steps. For experienced traders, combining multiple tools refines timing and improves decision making.
Technical analysis does not eliminate uncertainty, but it gives traders a structured framework for approaching it.
This information, including any opinions and analyses, is for educational purposes only and does not constitute financial advice or recommendation. You should always conduct your own research before making any investment decisions and are solely responsible for your actions and investment decisions.
The services of Freedx are not directed at, or intended for use by residents of the United States, Canada, and the United Arab Emirates, nor by any person in any jurisdiction where such use would be contrary to local laws or regulations.
© 2025 Freedx, All Rights Reserved